Intense rainfall
Concentrated events can exceed local drainage capacity within minutes.
Bring terrain, drainage, rainfall, urban assets and hydraulic results into one visual environment. Build scenarios, inspect flood evolution in 2D/3D, and turn model outputs into clearer decisions.
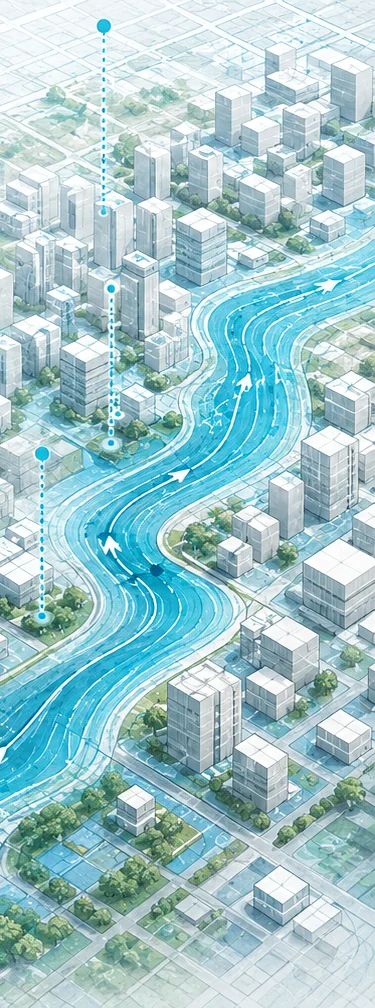
It emerges from the interaction between terrain, drainage capacity, urbanization and infrastructure. A useful model needs to keep those layers connected.
Concentrated events can exceed local drainage capacity within minutes.
Inlets, pipes and outlets may be restricted, blocked or undersized.
Topography directs water toward low points, corridors and critical assets.
Impervious surfaces and infrastructure bottlenecks amplify exposure and impact.
The interface is designed to keep scenario definition, simulation playback and spatial interpretation in the same context.
Terrain, drainage, rainfall, urban occupation and exposed assets.
Rainfall, flood sources, drainage behavior and time-dependent parameters.
Run the hydraulic calculation and track flood evolution through time.
Inspect depth, hazard, infrastructure and spatial relationships.
Compare scenarios and communicate evidence to technical teams and managers.
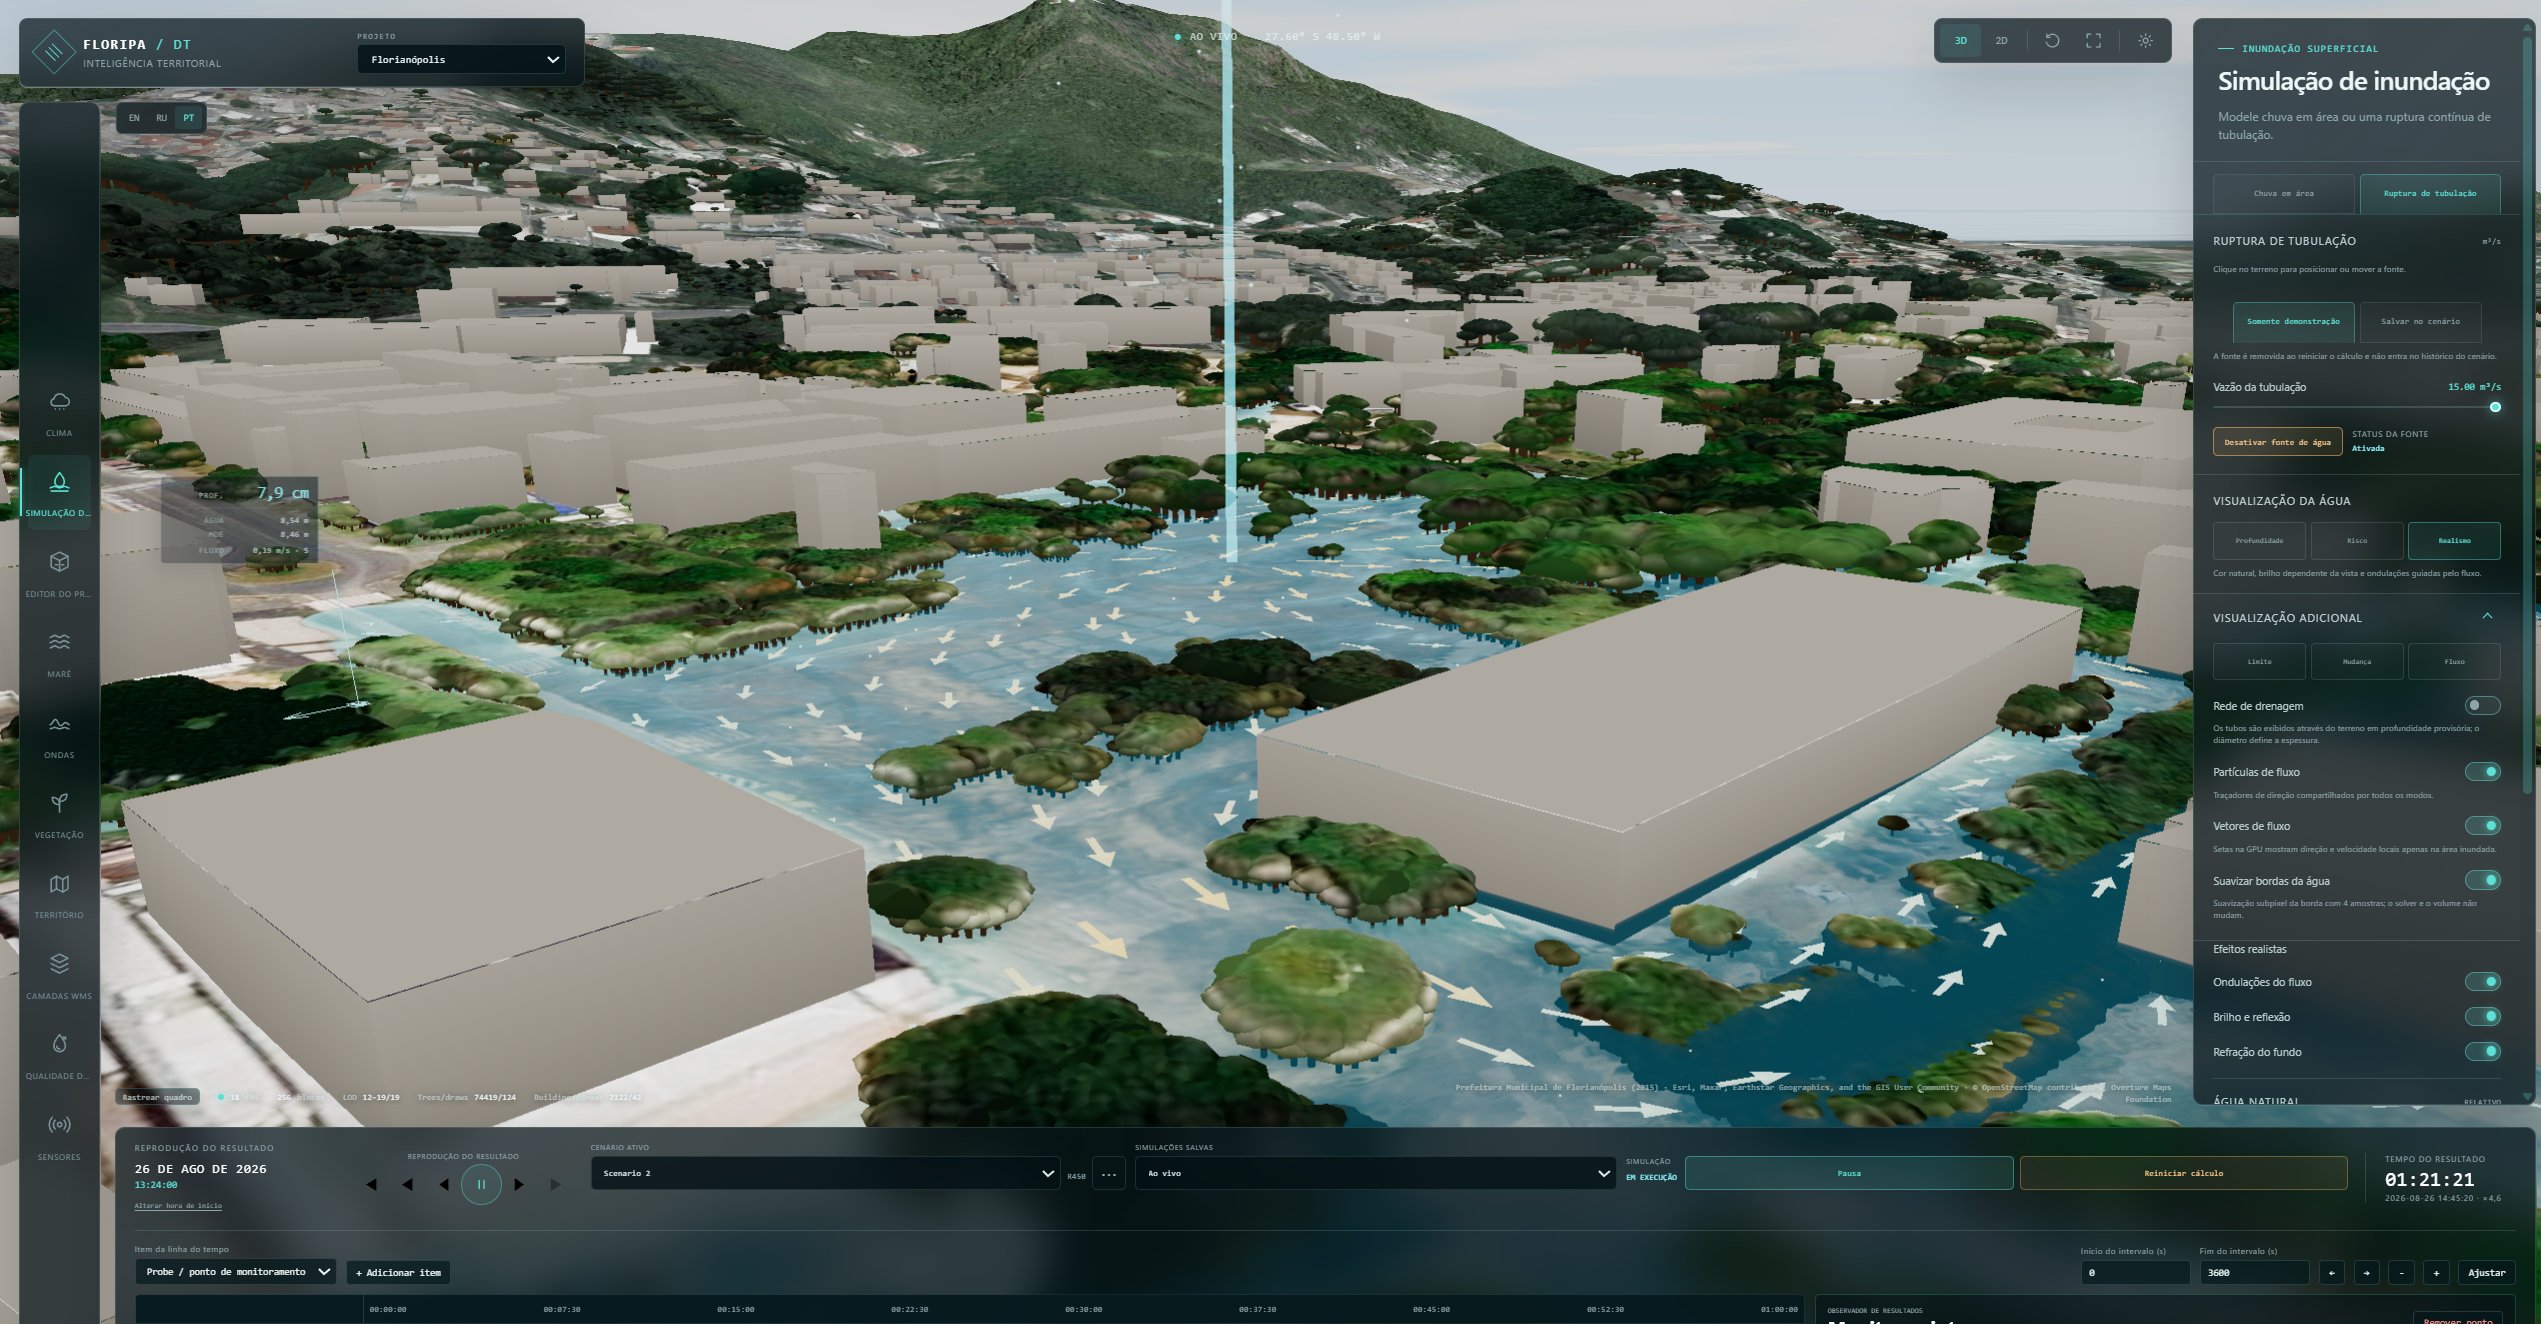
Watch the platform move from a city-scale 3D view to scenario playback, live flood behavior and result inspection.
Use the same spatial context to explore operational events, investment priorities and planning alternatives.
Anticipate critical areas and support event response.
Evaluate occupation, drainage and vulnerability together.
Identify bottlenecks, exposed assets and intervention priorities.
Compare scenarios and communicate potential impact.
Follow indicators and probe points throughout an event.
Make technical results easier to review with non-specialists.
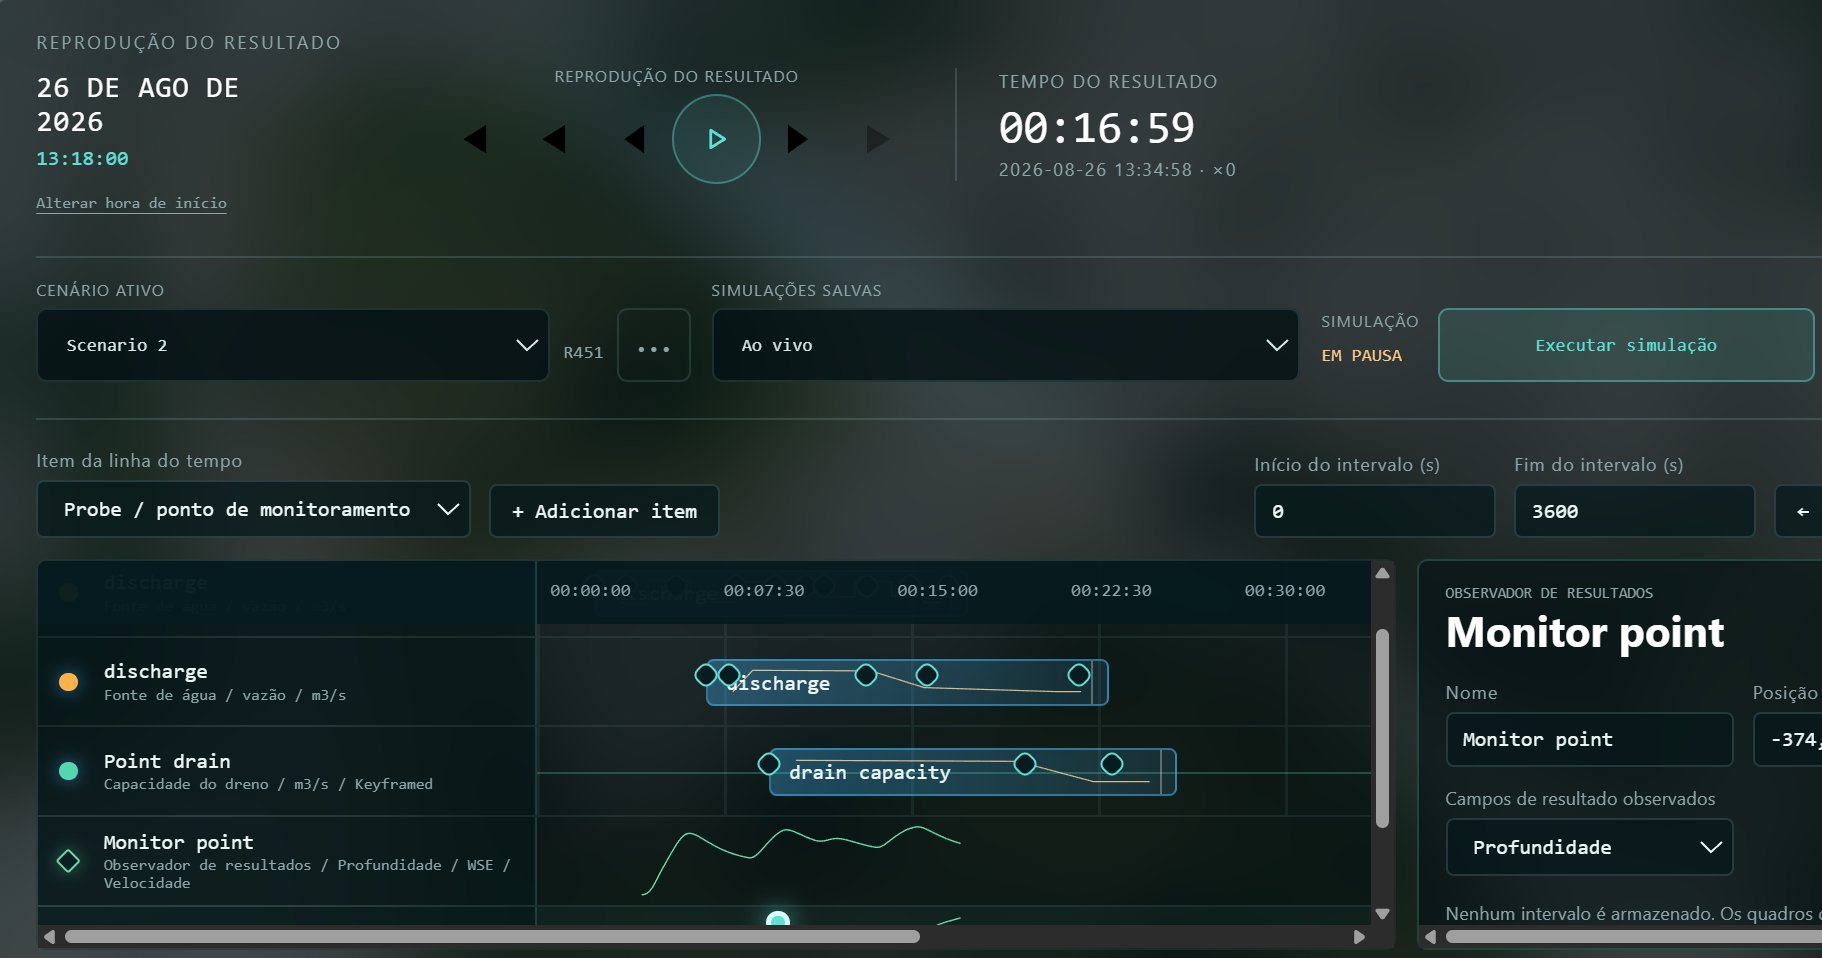
Scenario controls keep simulation timing and result playback together, while virtual monitoring points reveal depth, flow and velocity over time.
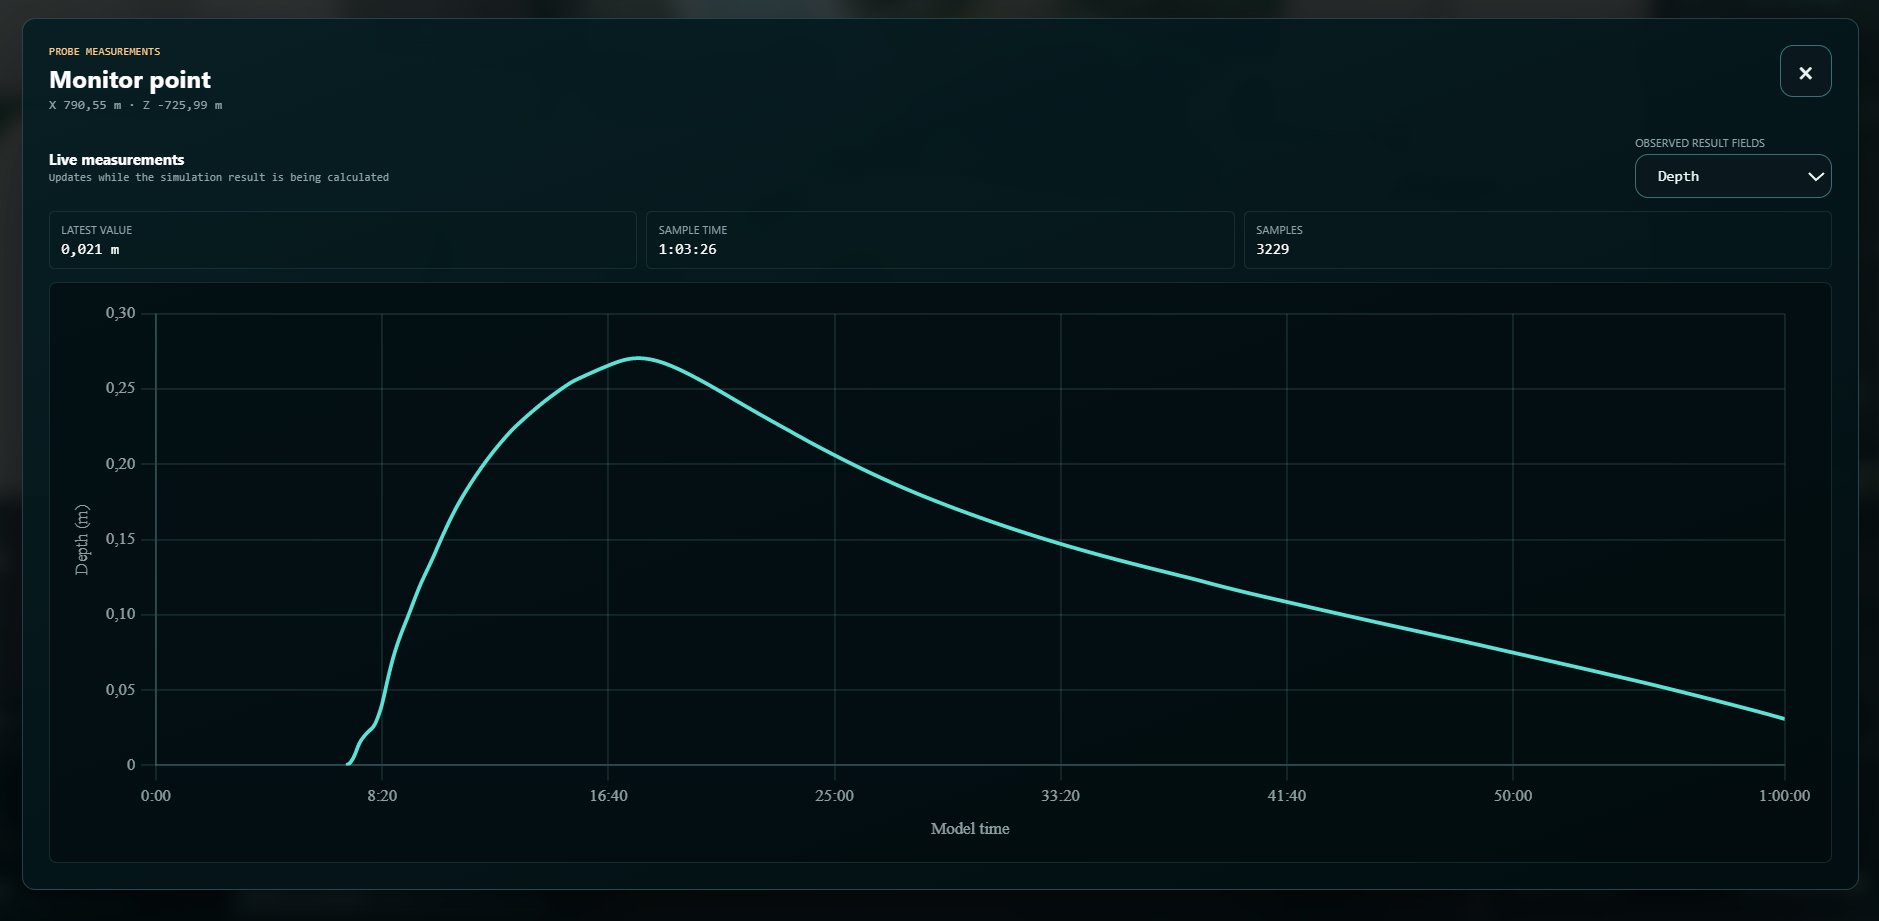
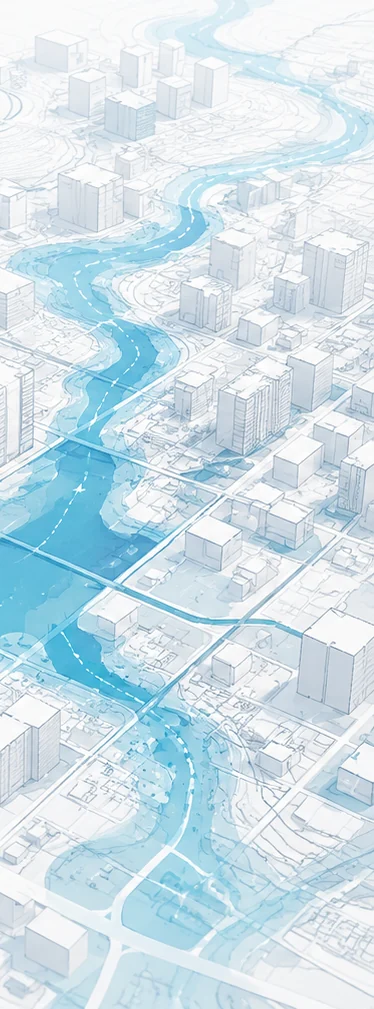
See how different assumptions change flood behavior, exposed infrastructure and the evidence available for a decision.
Request a demo on WhatsApp